
 Graphing and Understanding Quadratics
Topic A Key Information:
- Properties of Quadratics
- Graphing and Understanding Quadratics
As part of the introduction to quadratic equations, students need to graph the values from a simple quadratic. Students may find it helpful to complete this exercise with the help of a graphing calculator or graphing software. After graphing, students should discuss the results of what they see.
In the following example you will look at role of elements a,b,c in a quadratic equation, y=ax2 + bx +c.
Breaking down the elements of the equation:
- y is the y coordinate from an ordered pair (x, y)
- x is the x coordinate from an ordered pair (x, y)
- a is the element with the power of 2
- b is the element with the power of 1
- c is the y intercept
Using the expression, x2-3x+2, graph changes in the differences.
- Graph x2-3x+2. Describe what you see.
- Replace +3x with -3x
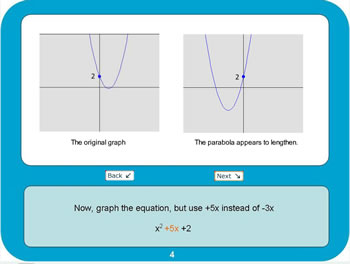
- Use 5x instead of -3x (the graph will result in a non-solution because the line will not cross the x-axis).
- Use +5 instead of +2
- 2x2 is replaces x2
- Next, define what happens when the coefficient of x or x2 has a negative and or positive value.
View the slide show to see these changes graphed.
Click on the image to view the slide show in a new browser window
View a printable version of the slideshow content
Therefore, after completing the above exploration you can see that the following rules apply to quadratic function f(x)=ax2 + bx +c:
- The positive/negative value of a determines whether the parabola faces up or down.
- The value of a determines the parabola’s width.
- The positive/negative value of b determines the horizontal position of the parabola.
- The value of b determines the parabola’s length.
- The value of c determines where the y intercept lies.
It is crucial that middle school students develop an understanding of these rules. Understanding and being able to explain the changes in variables helps students grasp the abstract concepts of changes in quadratic equations.
Idea for Classroom Application: Matching Graphs and EquationsDevelop a number of different graphs of both quadratic and linear equations. Place these graphs on a worksheet. On a separate worksheet, include the original equations with a number of random equations added. Have your students practice mapping the graphs with the equations. |